Modules
TankCore
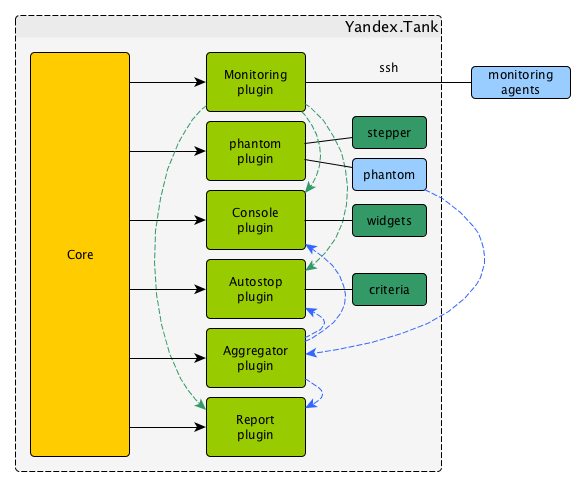
Core class. Represents basic steps of test execution. Simplifies plugin configuration, configs reading, artifacts storing. Represents parent class for modules/plugins.
yaml file section: core
Architecture
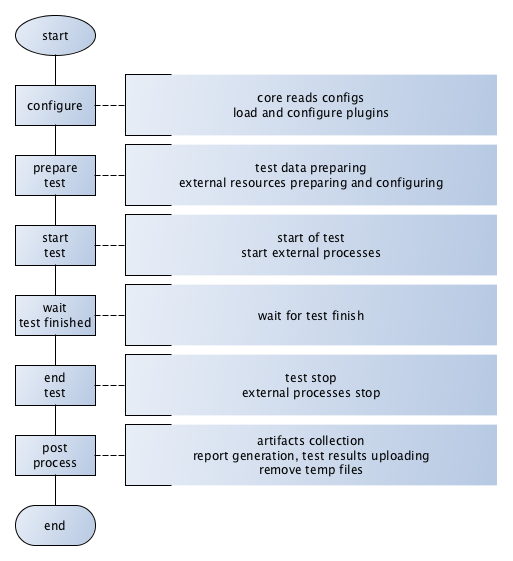
Test lifecycle
Options
Basic options:
- lock_dir
Directory for lockfile.
Default:
/var/lock/.- plugin_<pluginname>
Path to plugin. Empty path interpreted as disable of plugin.
- artifacts_base_dir
Base directory for artifacts storing. Temporary artifacts files are stored here.
Default: current directory.
- artifacts_dir
Directory where to keep artifacts after test.
Default: directory in
artifacts_base_dirnamed in Date/Time format.- flush_config_to
Dump configuration options after each tank step (yandex.tank steps. sorry, russian only) to that file
- taskset_path
Path to taskset command.
Default: taskset.
- affinity
Set a yandex-tank’s (python process and load generator process) CPU affinity.
Default: empty.
Example:
0-3enabling first 4 cores, ‘0,1,2,16,17,18’ enabling 6 cores.
consoleworker
Consoleworker is a cmd-line interface for Yandex.Tank.
Worker class that runs and configures TankCore accepting cmdline parameters. Human-friendly unix-way interface for yandex-tank. Command-line options described above.
apiworker
apiworker is a python interface for Yandex.Tank.
Worker class for python. Runs and configures TankCore accepting dict().
Python-frinedly interface for yandex-tank.
Example:
from yandextank.api.apiworker import ApiWorker
import logging
import traceback
import sys

logger = logging.getLogger('')
logger.setLevel(logging.DEBUG)

#not mandatory options below:
options = dict()
options['config'] = '/path/to/config/load.ini'
options['manual_start'] = "1"
options['user_options'] = [
    'phantom.ammofile=/path/to/ammofile',
    'phantom.rps_schedule=const(1,2m)',
]
log_filename = '/path/to/log/tank.log'
#======================================

apiworker = ApiWorker()
apiworker.init_logging(log_filename)
try:
    apiworker.configure(options)
    apiworker.perform_test()
except Exception, ex:
    logger.error('Error trying to perform a test: %s', ex)
exit codes
{
    "0": "completed",
    "1": "interrupted_generic_interrupt",
    "2": "interrupted",
    "3": "interrupted_active_task_not_found ",
    "4": "interrupted_no_ammo_file",
    "5": "interrupted_address_not_specified",
    "6": "interrupted_cpu_or_disk_overload",
    "7": "interrupted_unknown_config_parameter",
    "8": "interrupted_stop_via_web",
    "9": "interrupted",
    "11": "interrupted_job_number_error",
    "12": "interrupted_phantom_error",
    "13": "interrupted_job_metainfo_error",
    "14": "interrupted_target_monitoring_error",
    "15": "interrupted_target_info_error",
    "21": "autostop_time",
    "22": "autostop_http",
    "23": "autostop_net",
    "24": "autostop_instances",
    "25": "autostop_total_time",
    "26": "autostop_total_http",
    "27": "autostop_total_net",
    "28": "autostop_negative_http",
    "29": "autostop_negative_net",
    "30": "autostop_http_trend",
    "31": "autostop_metric_higher",
    "32": "autostop_metric_lower"
}
Load Generators
Phantom
Load generator module that uses phantom utility.
yaml file section: phantom
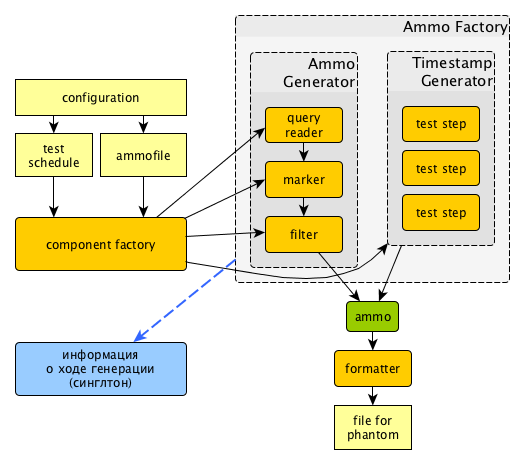
How it works
Options
Basic options
- ammofile
Ammo file path (ammo file is a file containing requests that are to be sent to a server. Could be gzipped).
- load_profile
Load profile behaviour. Specify load_type (
rps, schedule load by defining requests per second orinstances- schedule load defining concurrent active threads) and schedule.phantom: address: [hostname]:port load_profile: load_type: rps # schedule: line(1, 10, 10m) # starting from 1rps growing linearly to 10rps during 10 minutes
- instances
Max number of instances (concurrent requests).
- loop
Number of times requests from ammo file are repeated in loop.
- ammo_limit
Limit request number.
- autocases
Enable marking requests automatically.
autocases: 2means 2 uri path elements will be used. I.e/hello/world/please/helpwill produce case_hello_world- chosen_cases
Use only selected cases.
- There are 3 ways to constrain requests number:
by load_type
rpsandschedule,by requests number with
ammo_limitby loop number with
loopoption.
Tank stops if any constraint is reached.
If stop reason is reached ammo_limit or loop it will be mentioned in log file.
In test without load_type rps ammofile with requests used once by default.
Additional options
- writelog
Enable verbose request/response logging.
Default: 0.
Available options: 0 - disable, all - all messages, proto_warning - 4хх+5хх+network errors, proto_error - 5хх+network errors.
- ssl
Enable SSL.
Default: 0.
Available options: 1 - enable, 0 - disable.
- timeout
Response timeout.
Default:
11s.
Note
Default multiplier is seconds. If you specify 10, timeout will be 10 seconds.
Currently we support here multipliers: ‘d’ for days, ‘h’ for hours, ‘m’ for minutes, ‘s’ for seconds
Examples:
0.1s is 100 milliseconds.
1m for 1 minute.
- address
Address of target.
Default:
127.0.0.1.Format:
[host]:port,[ipv4]:port,[ipv6]:port. Tank checks each test if port is available.- gatling_ip
Use multiple source addresses. List, divided by spaces.
- tank_type
Available options:
httpandnone(raw TCP).Default:
http.- eta_file
Path to ETA file.
- connection_test
Test TCP socket connection before starting the test.
Default: 1.
Available options: 1 - enable, 0 - disable.
URI-style options
- uris
URI list, multiline option.
- headers
HTTP headers list in the following form: [Header: value].
- header_http
HTTP version.
Default:
1.0Available options:
1.0and1.1.Note
HTTP/2.0 is NOT supported by this load generator. Use Pandora or BFG.
stpd-file cache options
- use_caching
Enable cache.
Default:
1.- cache_dir
Cache files directory.
Default: base artifacts directory.
- force_stepping
Force stpd file generation.
Default:
0.
Advanced options
- phantom_path
Phantom utility path.
Default:
phantom.- phantom_modules_path
Phantom modules path.
Default:
/usr/lib/phantom.- config
Use given (in this option) config file for phantom instead of generated.
- phout_file
Import this phout instead of launching phantom (import phantom results).
- stpd_file
Use this stpd-file instead of generated.
- threads
Phantom thread count.
Default:
<processor cores count>/2 + 1.- buffered_seconds
Amount of seconds to which delay aggregator, to be sure that everything were read from phout.
- additional_libs
List separated by whitespaces, will be added to phantom config file in section
module_setup- method_prefix
Object’s type, that has a functionality to create test requests.
Default:
method_stream.- source_log_prefix
Prefix, added to class name that reads source data.
Default: empty.
- method_options
Additional options for method objects. It is used for Elliptics etc.
Default: empty.
- affinity
Set a phantom’s CPU affinity.
Example:
0-3enabling first 4 cores, ‘0,1,2,16,17,18’ enabling 6 cores.Default: empty.
TLS/SSL additional options
Note
ssl: 1 is required
- client_cipher_suites
Cipher list, consists of one or more cipher strings separated by colons (see man ciphers).
Example: client_cipher_suites = RSA:!COMPLEMENTOFALL
Default: empty.
- client_certificate
Path to client certificate which is used in client’s “Certificate message” in Client-authenticated TLS handshake.
Default: empty.
- client_key
Path to client’s certificate’s private key, used for client’s “CertificateVerify message” generation in Client-authenticated TLS handshake.
Default: empty.
Phantom http-module tuning options
- phantom_http_line
First line length.
Default:
1K.- phantom_http_field_num
Headers amount.
Default:
128.- phantom_http_field
Header size.
Default:
8K.- phantom_http_entity
Answer
size.Default:
8M.
Note
Please, keep in mind, especially if your service has large answers, that phantom doesn’t read more than defined in phantom_http_entity.
Artifacts
- phantom_*.conf
Generated configuration files.
- phout_*.log
Raw results file.
- phantom_stat_*.log
Phantom statistics, aggregated by seconds.
- answ_*.log
Detailed request/response log.
- phantom_*.log
Internal phantom log.
Multi-tests
To make several simultaneous tests with phantom, add proper amount of sections to special section multi for phantom. All subtests are executed in parallel. Multi-test ends as soon as one subtest stops.
Example:
phantom:
  address: hostname:port
  load_profile:
    load_type: rps
    schedule: const(1,30s)
  uris:
    - /
  autocases: 1
  multi:
    - address: hostname1:port1
      load_profile:
        load_type: rps
        schedule: const(1,10s)
      uris:
        - /123
        - /321
      ssl: 1
      autocases: 1
    - address: hostname2:port2
      load_profile:
        load_type: rps
        schedule: const(1,10s)
      uris:
        - /123
        - /321
      ssl: 1
      autocases: 1
telegraf:
  enabled: false
Options that apply only for main section:
buffered_seconds, writelog, phantom_modules_path, phout_file, config, eta_file, phantom_path
JMeter
JMeter module uses JMeter as a load generator. To enable it, disable phantom first (unless you really want to keep it active alongside at your own risk), enable JMeter plugin and then specify the parameters for JMeter:
phantom:
  enabled: false
jmeter:
  enabled: true
yaml file section: jmeter
Options
- jmx
Testplan for execution.
- args
Additional commandline arguments for JMeter.
- jmeter_path
Path to JMeter, allows to use alternative JMeter installation.
Default:
jmeter- buffered_seconds
Amount of seconds to which delay aggregator, to be sure that everything were read from jmeter’s results file.
- jmeter_ver
Which jmeter version tank should expect. Currently it affects the way connection time is logged, but may be used for other version-specific settings.
Default:
3.0- ext_log
Available options:
none,errors,all. Add one more simple data writer which logs all possible fields in jmeter xml format, this log is saved in test dir asjmeter_ext_XXXX.jtl.Default:
none- all other options in the section
They will be passed as User Defined Variables to JMeter.
Timing calculation issues
Since version 2.13 jmeter could measure connection time, latency and full request time (aka <interval_real> in phantom), but do it in it’s own uniq way: latency include connection time but not recieve time. For the sake of consistency we recalculate <latency> as <latency - connect_time> and calculate <recieve_time> as <interval_real - latency - connect_time>>, but it does not guranteed to work perfectly in all cases (i.e. some samplers may not support latency and connect_time and you may get something strange in case of timeouts).
For jmeter 2.12 and older connection time logging not avaliable, set jmeter_ver properly or you’ll
get an error for unknown field in Simlpe Data Writer listner added by tank.
Artifacts
- <original jmx>
Original testplan.
- <modified jmx>
Modified test plan with results output section.
- <jmeter_*.jtl>
JMeter’s results.
- <jmeter_*.log>
JMeter’s log.
BFG
(What is BFG) BFG is a generic gun that is able to use different kinds of cannons to shoot. To enable it, disable phantom first (unless you really want to keep it active alongside at your own risk), enable BFG plugin and then specify the parameters for BFG and for the gun of your choice.
There are three predefined guns: Log Gun, Http Gun and SQL gun. First two are mostly for demo, if you want to implement your own gun class, use them as an example.
But the main purpose of BFG is to support user-defined scenarios in python. Here is how you do it using ‘ultimate’ gun.
1. Define your scenario as a python class, for example, LoadTest (in a single-file module, for example, test in
current working directory ./), or a package:
import logging
log = logging.getLogger(__name__)


class LoadTest(object):
    def __init__(self, gun):

        # you'll be able to call gun's methods using this field:
        self.gun = gun

        # for example, you can get something from the 'ultimate' section of a config file:
        my_var = self.gun.get_option("my_var", "hello")

    def case1(self, missile):
        # we use gun's measuring context to measure time.
        # The results will be aggregated automatically:
        with self.gun.measure("case1"):
            log.info("Shoot case 1: %s", missile)

        # there could be multiple steps in one scenario:
        with self.gun.measure("case1_step2") as sample:
            log.info("Shoot case 1, step 2: %s", missile)
            # and we can set the fields of measured object manually:
            sample["proto_code"] = 500

            # the list of available fields is below

    def case2(self, missile):
        with self.gun.measure("case2"):
            log.info("Shoot case 2: %s", missile)

    def setup(self, param):
        ''' this will be executed in each worker before the test starts '''
        log.info("Setting up LoadTest: %s", param)

    def teardown(self):
        ''' this will be executed in each worker after the end of the test '''
        log.info("Tearing down LoadTest")
        #It's mandatory to explicitly stop worker process in teardown
        os._exit(0)
        return 0
Define your options in a config file:
phantom:
  enabled: false
bfg:
  enabled: true
  instances: 10
  gun_config:
    class_name: LoadTest
    module_path: ./
    module_name: test
    init_param: Hello
  gun_type: ultimate
  load_profile:
    load_type: rps
    schedule: const(1, 30s)
3. Create an ammo file: Ammo format: one line – one request, each line begins with case name separated by tab symbol (’t’). Case name defines the method of your test class that will be executed. The line itself will be passed to your method as ‘missile’ parameter. If there was no case name for an ammo, the ‘default’ case name will be used
case1<TAB>my-case1-ammo
case2<TAB>my-case2-ammo
my-default-case-ammo
Note
TIP: if each line is a JSON-encoded document, you can easily parse it inside your scenario code
Shoot em all!
How it works
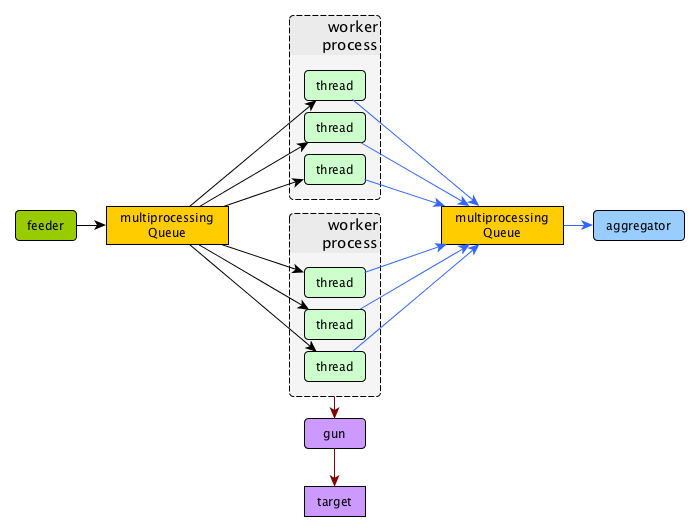
BFG Worker Type
By default, BFG will create lots of processes (number is defined by instances option).
Every process will execute requests in a single thread. These processes will consume a lot of memory.
It’s also possible to switch this behavior and use gevent to power up every worker process,
allowing it to have multiple concurrent threads executing HTTP requests.
With green worker, it’s recommended to set instances to number of CPU cores,
and adjust the number of real threads by green_threads_per_instance option.
- worker_type
Set it to
greento let every process have multiple concurrent green threads.- green_threads_per_instance
Number of green threads every worker process will execute. Only affects
greenworker type.
BFG Options
yaml file section: bfg
- gun_type
What kind of gun should BFG use.
- gun_config
Gun configuration options
- ammo_type
What ammo parser should BFG use.
Default:
caseline.- pip
Install python modules with
pip3 install --userbefore the test. If you need multiple modules use multiline options, i.e.:
pip=grequests
  msgpack
- init_param
An initialization parameter that will be passed to your
setupmethod.- other common stepper options
Ultimate Gun Options
yaml gun_type section: ultimate
Specify gun_config with:
- module_path
Path to your module
- module_name
Python module name
- class_name
Class that contains load scenarios, default: LoadTest
The fields of measuring context object and their default values:
- send_ts
A timestamp when context was entered.
- tag
A marker passed to the context.
- interval_real
The time interval from enter to exit. If the user defines his own value, it will be preserved. Microseconds.
- connect_time
Microseconds. Default: 0
- send_time
Microseconds. Default: 0
- latency
Microseconds. Default: 0
- receive_time
Microseconds. Default: 0
- interval_event
Microseconds. Default: 0
- size_out
Bytes out. Integer. Default: 0
- size_in
Bytes in. Integer. Default: 0
- net_code
Network code. Integer. Default: 0
- proto_code
Protocol code (http, for example). Integer. Default: 200
SQL Gun Options
SQL gun is deprecated. Use ultimate gun.
Pandora
Pandora is a load generator written in Go. For now it supports only SPDY/3 and HTTP(S). Plugins for other protocols (HTTP/2, Websocket, XMPP) are on the way.
First of all you’ll need to obtain a binary of pandora and place it somewhere on your machine.
By default, Yandex.Tank will try to just run pandora (or you could specify a path to binary in pandora_cmd).
Disable phantom first (unless you really want to keep it active alongside at your own risk), enable Pandora plugin and then specify the parameters.
# load.yaml

phantom:
  enabled: false
pandora:
  package: yandextank.plugins.Pandora
  enabled: true
  pandora_cmd: /usr/bin/pandora # Pandora executable path
  config_file: pandora_config.yml # Pandora config path
# pandora_config.yml

pools:
  - id: HTTP pool                    # pool name (for your choice)
    gun:
      type: http                     # gun type
      target: example.com:80         # gun target
    ammo:
      type: uri                      # ammo format
      file: ./ammo.uri               # ammo file path
    result:
      type: phout                    # report format (phout is compatible for Yandex.Tank)
      destination: ./phout.log       # report file name

    rps:                             # RPS scheduler - controls throughput over test
      type: line                     # linear growth load
      from: 1                        # from 1 responses per second
      to: 5                          # to 5 responses per second
      duration: 2s                   # for 2 seconds

    startup:                         # startup scheduler - control the level of parallelism
      type: once                     # start 5 instances
      times: 5                       #
You may specify pandora config contents in tank’s config file via `config_content` option.
This option has more priority over config_file option.
Create `ammo.uri` file, put your ammo inside and start the test.
# ammo.uri

/my/first/url
/my/second/url
Schedules
`Pandora`has two main RPS scheduler types:1.
line- makes linear load, where`from`and`to`are start and end, duration is a time for linear load increase from`from`to`to`.const- makes constant load, where`ops`is a load value for`duration`time.
Custom_guns
You can create you own Golang-based gun with pandora. Feel free to find examples at [pandora documentation](https://yandexpandora.readthedocs.io/en/develop/)
Artifact uploaders
Note
Graphite uploader are not currently supported in the last Yandex.Tank version. If you want one of them, use 1.7 branch.
Yandex.Overload
Overload 𝛃 is a service for performance analytics made by Yandex. We will store your performance experiments results and show them in graphic and tabular form. Your data will be available at https://overload.yandex.net.
yaml file section: overload
Options
- token_file
Place your token obtained from Overload (click your profile photo) into a file and specify the path here
- job_name
(Optional) Name of a job to be displayed in Yandex.Overload
- job_dsc
(Optional) Description of a job to be displayed in Yandex.Overload
Example:
overload:
  token_file: token.txt
  job_name: test
  job_dsc: test description
InfluxDB
InfluxDB uploader.
yaml file section: influx
Options
- address
(Optional) InfluxDB address. (Default: ‘localhost’)
- port
(Optional) InfluxDB port. (Default: 8086)
- database
(Optional) InfluxDB database. (Default: ‘mydb’)
- username
(Optional) InfluxDB user name. (Default: ‘root’)
- password
(Optional) InfluxDB password. (Default: ‘root’)
- labeled
(Optional) Send per-label (ammo tags) stats to influxdb. (Default: false)
- histograms
(Optional) Send response time histograms to influxdb. (Default: false)
- prefix_measurement
(Optional) Add prefix to measurement name. (Default: ‘’)
- tank_tag
(Optional) Tank tag. (Default: ‘unknown’)
- custom_tags
(Optional) Dict of custom tags, added to every sample row.
Example:
influx:
  enabled: true
  address: yourhost.tld
  database: yourbase
  tank_tag: 'mytank'
  prefix_measurement: 'your_test_prefix_'
  labeled: true
  histograms: true
Handy tools
Auto-stop
The Auto-stop module gets the data from the aggregator and passes them to the criteria-objects that decide if we should stop the test.
yaml file section: autostop
Options
- autostop
Criteria list in following format:
type(parameters)
Basic criteria types
- time
Stop the test if average response time is higher then allowed.
Example:
time(1s500ms, 30s) time(50,15).Exit code - 21
- http
Stop the test if the count of responses in time period (specified) with HTTP codes fitting the mask is larger then the specified absolute or relative value.
Examples:
http(404,10,15) http(5xx, 10%, 1m). Exit code - 22- net
Like
http, but for network codes. Usexxfor all non-zero codes.Exit code - 23
- quantile
Stop the test if the specified percentile is larger then specified level for as long as the time period specified.
Available percentile values: 25, 50, 75, 80, 90, 95, 98, 99, 100.
Example:
quantile (95,100ms,10s)Exit code - 21
- instances
Available when phantom module is included. Stop the test if instance count is larger then specified value.
Example:
instances(80%, 30) instances(50,1m).Exit code - 24
- metric_lower and metric_higher
Stop test if monitored metrics are lower/higher than specified for time period.
Example: metric_lower(127.0.0.1,Memory_free,500,10).
Exit code - 31 and 32
Note: metric names (except customs) are written with underline. For hostnames masks are allowed (i.e target-*.load.net)
- limit
Will stop test after specified period of time.
Example:
limit(1m).Exit code - 21
Basic criteria aren’t aggregated, they are tested for each second in specified period. For example autostop=time(50,15) means “stop if average responce time for every second in 15s interval is higher than 50ms”
Advanced criteria types
- total_time
Like
time, but accumulate for all time period (responses that fit may not be one-after-another, but only lay into specified time period).Example:
total_time(300ms, 70%, 3s).Exit code - 25
- total_http
Like
http, but accumulated. Seetotal_time.Example:
total_http(5xx,10%,10s) total_http(3xx,40%,10s).Exit code - 26
- total_net
Like
net, but accumulated. Seetotal_time.Example:
total_net(79,10%,10s) total_net(11x,50%,15s)Exit code - 27
- negative_http
Inversed
total_http. Stop if there are not enough responses that fit the specified mask. Use to be shure that server responds 200.Example:
negative_http(2xx,10%,10s).Exit code - 28
- negative_net
Inversed
total_net. Stop if there are not enough responses that fit the specified mask.Example:
negative_net(0,10%,10s).Exit code - 29
- http_trend
Stop if trend for defined http codes is negative on defined period. Trend is a sum of an average coefficient for linear functions calculated for each pair points in last n seconds and standart deviation for it
Example: http_trend(2xx,10s).
Exit code - 30
Сriteria for specific tag
All criteria except limit could be used not for all test, but for a specially tagged uri.
Example: time(1s, 5s, /latest/index/)
Stop test if average response time is higher than 1s ONLY from uri with tag /latest/index/ for 5s.
It can be used for developing specific test success criteria for each uri.
Example:
autostop:
  autostop:
    - http(4xx, 20%, 15s, GET /weff?id=1)
    - http(4xx, 5%, 5s, POST /authorize)
Stop test if there’re more than 5% of 4xx codes for uri with tag POST /authorize or if there’re more than 20% of 4xx codes for uri with tag GET /weff?id=1.
Telegraf
Runs metrics collection through SSH connection. You can debug your SSH connection using yandex-tank-check-ssh tool.
It is supplied with Yandex.Tank.
Credits to https://github.com/influxdata/telegraf for metric collection agent.
# load.yaml
# ...
telegraf:
  enabled: true
  package: yandextank.plugins.Telegraf
In https://github.com/yandex/yandex-tank/blob/master/yandextank/core/config/00-base.yaml it is already done. Please, don’t use both yandextank.plugins.Telegraf and yandextank.plugins.Monitoring simultaneously.
Config file section: telegraf
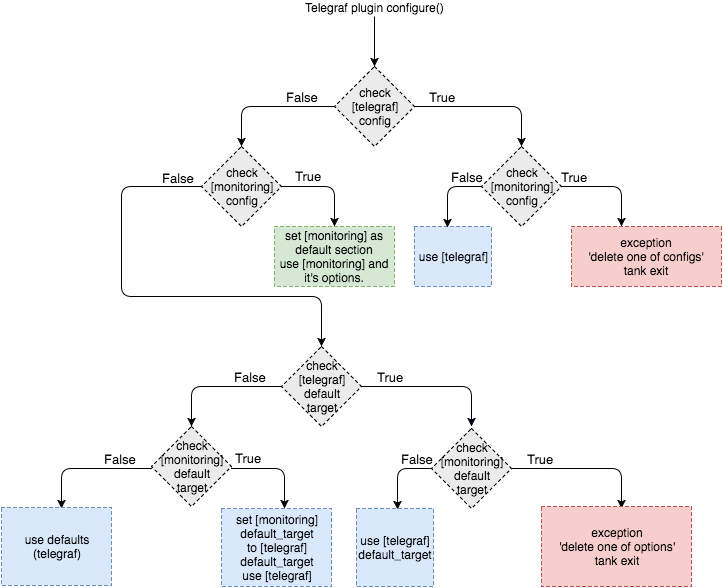
You can use old monitoring config format, if you specify it in monitoring section. Telegraf plugin transparently supports it. You can use new monitoring config format, if you specify it in telegraf section.
Backward compatibility logic:
Telegraf plugin automatically uploads telegraf collector binary to target from tank if exists.
Options
- config
Path to monitoring config file.
Default:
automeans collect default metrics fromdefault_targethost. Ifnoneis defined, monitoring won’t be executed. Also it is possible to write plain multiline XML config.- default_target
An address where from collect “default” metrics. When phantom module is used, address will be obtained from it.
- ssh_timeout
Ssh connection timeout.
Default: 5s
- disguise_hostnames
Disguise real host names.
Default: 0
Configuration
Net access and authentication
Telegraf requires ssh access to hosts for copy and executing agents/telegraf collector binaries on them. SSH session is established with user account specified by “username” parameter of Host element, otherwise current user account, so you need to copy your public keys (ssh-copy-id) and enable nonpassword authorization on hosts.
If connection establishing failed for some reason in ssh_timeout seconds, corresponding message will be written to console and monitoring log and task will proceed further.
Tip: write to .ssh/config next lines to eliminate -A option in ssh
StrictHostKeyChecking no
ForwardAgent yes
Configuration file format
Config is an XML file with structure:
root element Monitoring includes elements Host which contains elements-metrics
Example:
<Monitoring>
    <Host address="somehost.tld" interval="1" username="netort">
        <CPU fielddrop='["time_*", "usage_guest_nice"]'></CPU>
        <Kernel fielddrop='["active", "inactive", "total", "used_per*", "avail*"]'></Kernel>
        <Net fielddrop='["icmp*", "ip*", "udplite*", "tcp*", "udp*", "drop*", "err*"]' interfaces='["eth0","eth1","lo"]'></Net>
        <System fielddrop='["n_users", "n_cpus", "uptime*"]'></System>
        <Memory fielddrop='["active", "inactive", "total", "used_per*", "avail*"]'></Memory>
        <Disk devices='["vda1","sda1","sda2","sda3"]'></Disk>
        <Netstat />
        <Custom diff="1" measure="call" label="test">curl -s -H 'Host: host.tld' 'http://localhost:6100/stat'  | python3 -c 'import sys, json; j = json.load(sys.stdin); print("\n".join(`c["values"]["accept"]` for c in j["charts"] if c["name"] == "localqueue_wait_time"))'</Custom>
        <Source>/path/to/file</Source>
        <TelegrafRaw>
            [[inputs.ping]]
            urls = ["127.0.0.1"]
            count = 1
        </TelegrafRaw>
    </Host>

    <Host address="localhost" telegraf="/usr/bin/telegraf">
        <CPU percpu="true"></CPU>
        <NetResponse address="localhost:80" protocol="tcp" timeout="1s"></NetResponse>
        <Net fielddrop='["icmp*", "ip*", "udplite*", "tcp*", "udp*", "drop*", "err*"]' interfaces='["eth0","eth1","docker0","lo"]'></Net>
    </Host>
</Monitoring>
Element Host
Contains address and role of monitored server. Attributes:
- address=”<IP address or domain name>
Server adddress. Mandatory. Special mask
[target]could be used here, which means “get from the tank target address”- port=”<SSH port>”
Server’s ssh port. Optional.
Default: 22
- python=”<python path>”
The way to use alternative python version. Optional.
- interval=”<seconds>”
Metrics collection interval. Optional.
Default: 1 second
- comment=”<short commentary>”
Short notice about server’s role in test. Optional.
Default: empty
- username=”<user name>”
User account to connect with. Optional.
Default: current user account.
- telegraf=”/path/to/telegraf”
Path to telegraf binary on remote host. Optional.
Default: /usr/bin/telegraf
Example:
<Host address="localhost" comment="frontend" interval="5" username="tank"/>
Metric elements
Metric elements in general are set by metrics group name.
There are plenty of config-wide configuration options (such as ‘fielddrop’, ‘fieldpass’ etc, you can read about them here: https://github.com/influxdata/telegraf/blob/master/docs/CONFIGURATION.md
List of metrics group names and particular metrics in them:
- CPU
percpu - default: false
System
Memory
- Disk
devices - default: “,”.join([‘“vda%s”,”sda%s”’ % (num, num) for num in range(6)]). Format sample: [“sda1”, “docker0”]
- Net
interfaces - default: “,”.join([‘“eth%s”’ % (num) for num in range(6)]). Format sample: [“eth0”,”eth1”]
Netstat
Kernel
KernelVmstat
- NetResponse
protocol - default: “tcp”. Protocol, must be “tcp” or “udp”
address - default: “:80”. Server address and port
timeout - default: “1s”. Set timeout
send - default: None. Optional string sent to the server
expect - default: None. Optional expected string in answer
- Custom
diff - default: 0
measure - default: call - metric value is a command or script execution output. Example: <Custom measure=”call” diff=”1” label=”Base size”>du -s /var/lib/mysql/ | awk ‘{print $1}’</Custom>
- TelegrafRaw
raw telegraf TOML format, transparently added to final collector config
- Source
additional source file in telegraf json format, can be used to add custom metrics that needs complex processing and do not fit into standart custom metrics (like log parsing with aggregation). Custom metrics do not include timestamps but source does. You can import async data with Source.
Config Host section example:
<Source>/path/to/file</Source>File format:
jsonline. Each line is a json document.Example:
{"fields":{"metric_name_1":0,"metric_name_2":98.27694231863998,},"name":"custom_group-name","timestamp":1503990965}
Console on-line screen
Shows usefull information in console while running the test
Config file section: console
Options
- short_only
Show only one-line summary instead of full-screen. Usefull for scripting.
Default: 0 (disabled)
- info_panel_width
relative right-panel width in percents,
Default: 33
- disable_all_colors
Switch off color scheme
Available options: 0/1
Default: 0
- disable_colors
Don’t use specified colors in console. List with whitespaces. Example:
WHITE GREEN RED CYAN MAGENTA YELLOW
Aggregator
The aggregator module is responsible for aggregation of data received from different kind of modules and transmitting that aggregated data to consumer modules.
ShellExec
The ShellExec module executes the shell-scripts (hooks) on different stages of test, for example, you could start/stop some services just before/after the test. Every hook must return 0 as an exit code or the test is terminated. Hook’s stdout will be written to DEBUG, stderr will be WARNINGs.
Example:
# load.yaml
# ...
shellexec:
  start: /bin/ls -l
Note
Command quoting is not needed. That line doesn’t work: start="/bin/ls -l"
Config file section: shellexec
Options
- prepare
The script to run on prepare stage.
- start
The script to run on start stage.
- poll
The script to run every second while the test is running.
- end
The script to run on end stage.
- post_process
The script to run on postprocess stage
Resource Check
Module checks free memory and disk space amount before and during test. Test stops if minimum values are reached.
yaml file section: rcheck
Options
- interval
How often to check resources.
Default interval:
10s- disk_limit
Minimum free disk space in MB.
Default:
2GB- mem_limit
Minimum free memory amount in MB.
Default:
512MB
RC Assert
Module checks test’s exit code with predefined acceptable codes. If exit code matches, it is overrides as 0. Otherwise it is replaced with code from option fail_code
yaml file section: rcassert
Options
- pass
list of acceptable codes, delimiter - whitespace.
Default: empty, no check is performed.
- fail_code
Exit code when check fails, integer number.
Default: 10