Modules
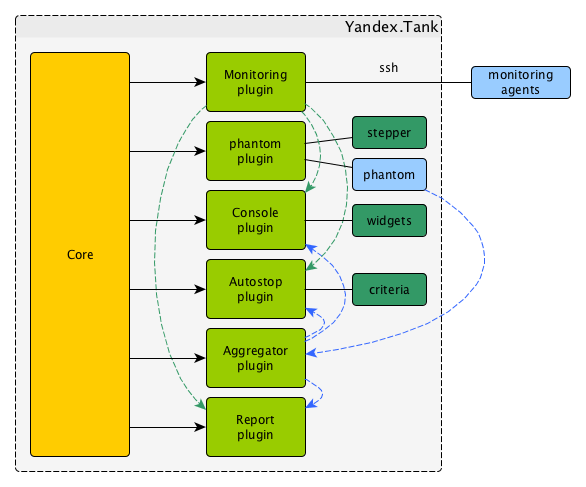
TankCore
Core class. Represents basic steps of test execution. Simplifies plugin configuration, configs reading, artifacts storing. Represents parent class for modules/plugins.
INI file section: [tank]
Architecture
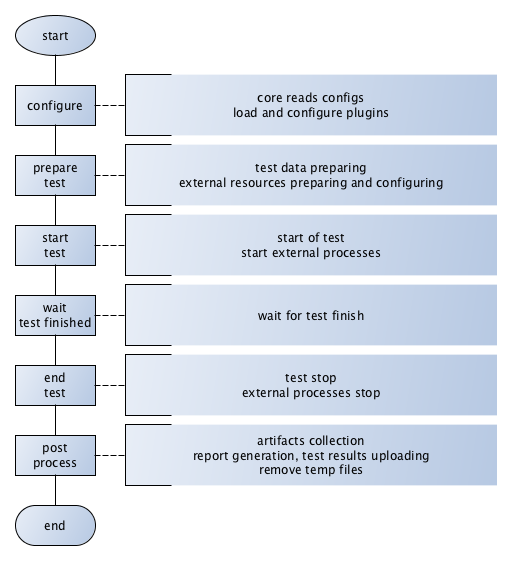
Test lifecycle
Options
Basic options:
| lock_dir: | Directory for lockfile. Default: |
|---|---|
| plugin_<pluginname>: | |
Path to plugin. Empty path interpreted as disable of plugin. |
|
| artifacts_base_dir: | |
Base directory for artifacts storing. Temporary artifacts files are stored here. Default: current directory. |
|
| artifacts_dir: | Directory where to keep artifacts after test. Default: directory in |
| flush_config_to: | |
Dump configuration options after each tank step (yandex.tank steps. sorry, russian only) to that file |
|
| taskset_path: | Path to taskset command. Default: taskset. |
| affinity: | Set a yandex-tank’s (python process and load generator process) CPU affinity. Default: empty. Example: |
consoleworker
Consoleworker is a cmd-line interface for Yandex.Tank.
Worker class that runs and configures TankCore accepting cmdline parameters. Human-friendly unix-way interface for yandex-tank. Command-line options described above.
apiworker
apiworker is a python interface for Yandex.Tank.
Worker class for python. Runs and configures TankCore accepting dict().
Python-frinedly interface for yandex-tank.
Example:
from yandextank.api.apiworker import ApiWorker
import logging
import traceback
import sys

logger = logging.getLogger('')
logger.setLevel(logging.DEBUG)

#not mandatory options below:
options = dict()
options['config'] = '/path/to/config/load.ini'
options['manual_start'] = "1"
options['user_options'] = [
    'phantom.ammofile=/path/to/ammofile',
    'phantom.rps_schedule=const(1,2m)',
]
log_filename = '/path/to/log/tank.log'
#======================================

apiworker = ApiWorker()
apiworker.init_logging(log_filename)
try:
    apiworker.configure(options)
    apiworker.perform_test()
except Exception, ex:
    logger.error('Error trying to perform a test: %s', ex)
exit codes
{
    "0": "completed",
    "1": "interrupted_generic_interrupt",
    "2": "interrupted",
    "3": "interrupted_active_task_not_found ",
    "4": "interrupted_no_ammo_file",
    "5": "interrupted_address_not_specified",
    "6": "interrupted_cpu_or_disk_overload",
    "7": "interrupted_unknown_config_parameter",
    "8": "interrupted_stop_via_web",
    "9": "interrupted",
    "11": "interrupted_job_number_error",
    "12": "interrupted_phantom_error",
    "13": "interrupted_job_metainfo_error",
    "14": "interrupted_target_monitoring_error",
    "15": "interrupted_target_info_error",
    "21": "autostop_time",
    "22": "autostop_http",
    "23": "autostop_net",
    "24": "autostop_instances",
    "25": "autostop_total_time",
    "26": "autostop_total_http",
    "27": "autostop_total_net",
    "28": "autostop_negative_http",
    "29": "autostop_negative_net",
    "30": "autostop_http_trend",
    "31": "autostop_metric_higher",
    "32": "autostop_metric_lower"
}
Load Generators
Phantom
Load generator module that uses phantom utility.
INI file section: [phantom]
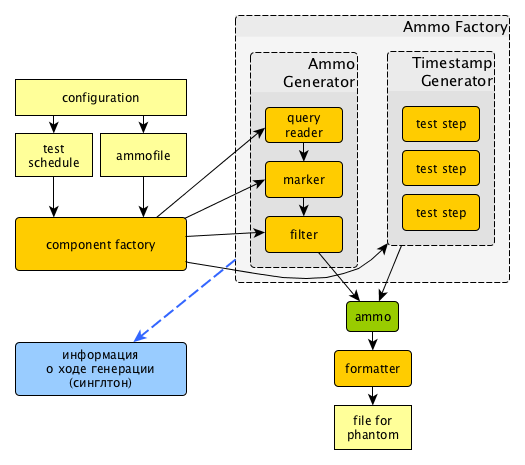
How it works
Options
Basic options
| ammofile: | Ammo file path (ammo file is a file containing requests that are to be sent to a server. Could be gzipped). |
|---|---|
| rps_schedule: | Load schedule in terms of RPS. |
| instances: | Max number of instances (concurrent requests). |
| instances_schedule: | |
Load schedule in terms of number of instances. |
|
| loop: | Number of times requests from ammo file are repeated in loop. |
| ammo_limit: | Limit request number. |
| autocases: | Enable marking requests automatically. Available options: 1 – enable, 0 – disable). |
| chosen_cases: | Use only selected cases. |
There are 3 ways to constrain requests number: by schedule with rps_schedule, by requests number with ammo_limit or by loop number with loop option. Tank stops if any constrain is reached. If stop reason is reached ammo_limit or loop it will be mentioned in log file. In test without rps_schedule file with requests is used one time by default.
Additional options
| writelog: | Enable verbose request/response logging. Default: 0. Available options: 0 - disable, all - all messages, proto_warning - 4хх+5хх+network errors, proto_error - 5хх+network errors. |
|---|---|
| ssl: | Enable SSL. Default: 0. Available options: 1 - enable, 0 - disable. |
| timeout: | Response timeout. Default: |
Note
Default multiplier is seconds. If you specify 10, timeout will be 10 seconds.
Currently we support here multipliers: ‘d’ for days, ‘h’ for hours, ‘m’ for minutes, ‘s’ for seconds
Examples:
0.1s is 100 milliseconds.
1m for 1 minute.
| address: | Address of target. Default: Format: |
|---|---|
port (deprecated, use address): | |
Port of target. Default: |
|
| gatling_ip: | Use multiple source addresses. List, divided by spaces. |
| tank_type: | Available options: Default: |
| eta_file: | Path to ETA file. |
| connection_test: | |
Test TCP socket connection before starting the test. Default: 1. Available options: 1 - enable, 0 - disable. |
|
URI-style options
| uris: | URI list, multiline option. |
|---|---|
| headers: | HTTP headers list in the following form: |
| header_http: | HTTP version. Default: Available options: |
stpd-file cache options
| use_caching: | Enable cache. Default: |
|---|---|
| cache_dir: | Cache files directory. Default: base artifacts directory. |
| force_stepping: | Force stpd file generation. Default: |
Advanced options
| phantom_path: | Phantom utility path. Default: |
|---|---|
| phantom_modules_path: | |
Phantom modules path. Default: |
|
| config: | Use given (in this option) config file for phantom instead of generated. |
| phout_file: | Import this phout instead of launching phantom (import phantom results). |
| stpd_file: | Use this stpd-file instead of generated. |
| threads: | Phantom thread count. Default: |
| buffered_seconds: | |
Amount of seconds to which delay aggregator, to be sure that everything were read from phout. |
|
| additional_libs: | |
List separated by whitespaces, will be added to phantom config file in section |
|
| method_prefix: | Object’s type, that has a functionality to create test requests. Default: |
| source_log_prefix: | |
Prefix, added to class name that reads source data. Default: empty. |
|
| method_options: | Additional options for method objects. It is used for Elliptics etc. Default: empty. |
| affinity: | Set a phantom’s CPU affinity. Example: Default: empty. |
TLS/SSL additional options
Note
ssl=1 is required
| client_cipher_suites: | |
|---|---|
Cipher list, consists of one or more cipher strings separated by colons (see man ciphers). Example: client_cipher_suites = RSA:!COMPLEMENTOFALL Default: empty. |
|
| client_certificate: | |
Path to client certificate which is used in client’s “Certificate message” in Client-authenticated TLS handshake. Default: empty. |
|
| client_key: | Path to client’s certificate’s private key, used for client’s “CertificateVerify message” generation in Client-authenticated TLS handshake. Default: empty. |
Phantom http-module tuning options
| phantom_http_line: | |
|---|---|
First line length. Default: |
|
| phantom_http_field_num: | |
Headers amount. Default: |
|
| phantom_http_field: | |
Header size. Default: |
|
| phantom_http_entity: | |
Answer Default: |
|
Note
Please, keep in mind, especially if your service has large answers, that phantom doesn’t read more than defined in phantom_http_entity.
Artifacts
| phantom_*.conf: | Generated configuration files. |
|---|---|
| phout_*.log: | Raw results file. |
| phantom_stat_*.log: | |
| Phantom statistics, aggregated by seconds. | |
| answ_*.log: | Detailed request/response log. |
| phantom_*.log: | Internal phantom log. |
Multi-tests
To make several simultaneous tests with phantom, add proper amount of sections with names phantom-_N_. All subtests are executed in parallel. Multi-test ends as soon as one subtest stops.
Example:
[phantom]
phantom_path=phantom
ammofile=data/dummy.ammo
instances=10
instances_schedule=line(1,10,1m)
loop=1
use_caching=1

[phantom-1]
uris=/
        /test
        /test2
headers=[Host: www.ya.ru]
        [Connection: close]
rps_schedule=const(1,30) line(1,1000,2m) const(1000,5m)
address=fe80::200:f8ff:fe21:67cf
port=8080
ssl=1
timeout=15
instances=3
gatling_ip=127.0.0.1 127.0.0.2
phantom_http_line=123M

[phantom-2]
uris=/3
rps_schedule=const(1,30) line(1,50,2m) const(50,5m)
Options that apply only for main section: buffered_seconds, writelog, phantom_modules_path, phout_file, config, eta_file, phantom_path
JMeter
JMeter module uses JMeter as a load generator. To enable it, disable phantom first (unless you really want to keep it active alongside at your own risk), enable JMeter plugin and then specify the parameters for JMeter:
[tank]
; Disable phantom:
plugin_phantom=
; Enable JMeter instead:
plugin_jmeter=yandextank.plugins.JMeter
INI file section: [jmeter]
Options
| jmx: | Testplan for execution. |
|---|---|
| args: | Additional commandline arguments for JMeter. |
| jmeter_path: | Path to JMeter, allows to use alternative JMeter installation. Default: |
| buffered_seconds: | |
Amount of seconds to which delay aggregator, to be sure that everything were read from jmeter’s results file. |
|
| jmeter_ver: | Which jmeter version tank should expect. Currently it affects the way connection time is logged, but may be used for other version-specific settings. Default: |
| ext_log: | Available options: Default: |
| all other options in the section: | |
They will be passed as User Defined Variables to JMeter. |
|
Timing calculation issues
Since version 2.13 jmeter could measure connection time, latency and full request time (aka <interval_real> in phantom), but do it in it’s own uniq way: latency include connection time but not recieve time. For the sake of consistency we recalculate <latency> as <latency - connect_time> and calculate <recieve_time> as <interval_real - latency - connect_time>>, but it does not guranteed to work perfectly in all cases (i.e. some samplers may not support latency and connect_time and you may get something strange in case of timeouts).
For jmeter 2.12 and older connection time logging not avaliable, set jmeter_ver properly or you’ll get an error for unknown field in Simlpe Data Writer listner added by tank.
Artifacts
| <original jmx>: | Original testplan. |
|---|---|
| <modified jmx>: | Modified test plan with results output section. |
| <jmeter_*.jtl>: | JMeter’s results. |
| <jmeter_*.log>: | JMeter’s log. |
BFG
(What is BFG) BFG is a generic gun that is able to use different kinds of cannons to shoot. To enable it, disable phantom first (unless you really want to keep it active alongside at your own risk), enable BFG plugin and then specify the parameters for BFG and for the gun of your choice.
There are three predefined guns: Log Gun, Http Gun and SQL gun. First two are mostly for demo, if you want to implement your own gun class, use them as an example.
But the main purpose of BFG is to support user-defined scenarios in python. Here is how you do it using ‘ultimate’ gun.
- Define your scenario as a python class (in a single-file module, or a package):
import logging
log = logging.getLogger(__name__)


class LoadTest(object):
    def __init__(self, gun):

        # you'll be able to call gun's methods using this field:
        self.gun = gun

        # for example, you can get something from the 'ultimate' section of a config file:
        my_var = self.gun.get_option("my_var", "hello")

    def case1(self, missile):
        # we use gun's measuring context to measure time.
        # The results will be aggregated automatically:
        with self.gun.measure("case1"):
            log.info("Shoot case 1: %s", missile)

        # there could be multiple steps in one scenario:
        with self.gun.measure("case1_step2") as sample:
            log.info("Shoot case 1, step 2: %s", missile)
            # and we can set the fields of measured object manually:
            sample["proto_code"] = 500

            # the list of available fields is below

    def case2(self, missile):
        with self.gun.measure("case2"):
            log.info("Shoot case 2: %s", missile)

    def setup(self, param):
        ''' this will be executed in each worker before the test starts '''
        log.info("Setting up LoadTest: %s", param)

    def teardown(self):
        ''' this will be executed in each worker after the end of the test '''
        log.info("Tearing down LoadTest")
- Define your options in a config file:
[tank]
; Disable phantom:
plugin_phantom=
; Enable BFG instead:
plugin_bfg=yandextank.plugins.Bfg

[bfg]
; parallel processes count
instances = 10
; gun type
gun_type = ultimate

; ammo file
ammofile=req_json.log

; load schedule
rps_schedule=line(1,100,10m)

[ultimate_gun]
; path to your custom module
module_path = ./my_own_service
; python module name
module_name = mygun
; gun initialization parameter
init_param = Hello
3. Create an ammo file: Ammo format: one line – one request, each line begins with case name separated by tab symbol (‘t’). Case name defines the method of your test class that will be executed. The line itself will be passed to your method as ‘missile’ parameter. If there was no case name for an ammo, the ‘default’ case name will be used
case1<TAB>my-case1-ammo
case2<TAB>my-case2-ammo
my-default-case-ammo
Note
TIP: if each line is a JSON-encoded document, you can easily parse it inside your scenario code
- Shoot em all!
How it works
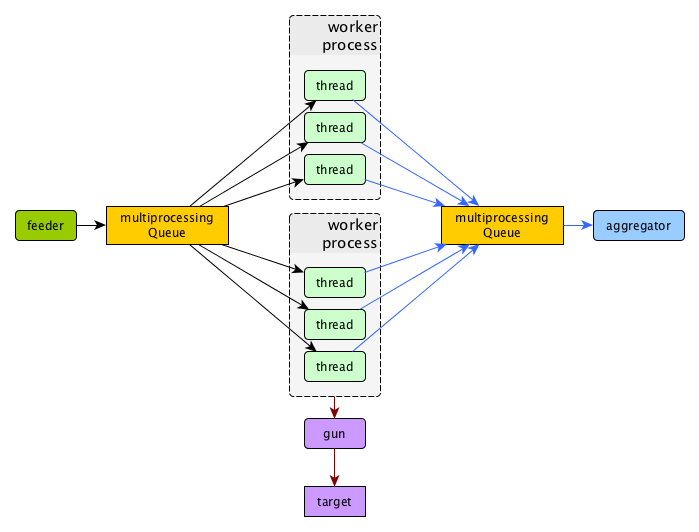
BFG Worker Type
By default, BFG will create lots of processes (number is defined by instances option).
Every process will execute requests in a single thread. These processes will comsume a lot of memory.
It’s also possible to switch this behavior and use gevent to power up every worker process,
allowing it to have multiple concurrent threads executing HTTP requests.
With green worker, it’s recommended to set instances to number of CPU cores,
and adjust the number of real threads by green_threads_per_instance option.
INI file section: [bfg]
| worker_type: | Set it to green to let every process have multiple concurrent green threads. |
|---|---|
| green_threads_per_instance: | |
Number of green threads every worker process will execute. Only affects green worker type. |
|
BFG Options
INI file section: [bfg]
| gun_type: | What kind of gun should BFG use. |
|---|---|
| ammo_type: | What ammo parser should BFG use. Default: |
| pip: | Install python modules with |
| init_param: | An initialization parameter that will be passed to your |
| other common stepper options: | |
Ultimate Gun Options
gun_type = ultimate
INI file section: [ultimate_gun]
| module_path: | Path to your module |
|---|---|
| module_name: | Python module name |
| class_name: | Class that contains load scenarios, default: LoadTest |
The fields of measuring context object and their default values:
| send_ts: | A timestamp when context was entered. |
|---|---|
| tag: | A marker passed to the context. |
| interval_real: | The time interval from enter to exit. If the user defines his own value, it will be preserved. Microseconds. |
| connect_time: | Microseconds. Default: 0 |
| send_time: | Microseconds. Default: 0 |
| latency: | Microseconds. Default: 0 |
| receive_time: | Microseconds. Default: 0 |
| interval_event: | Microseconds. Default: 0 |
| size_out: | Bytes out. Integer. Default: 0 |
| size_in: | Bytes in. Integer. Default: 0 |
| net_code: | Network code. Integer. Default: 0 |
| proto_code: | Protocol code (http, for example). Integer. Default: 200 |
Pandora
Pandora is a load generator written in Go. For now it supports only SPDY/3 and HTTP(S). Plugins for other protocols (HTTP/2, Websocket, XMPP) are on the way.
First of all you’ll need to obtain a binary of pandora and place it somewhere on your machine.
By default, Yandex.Tank will try to just run pandora (or you could specify a path to binary in pandora_cmd).
Disable phantom first (unless you really want to keep it active alongside at your own risk), enable Pandora plugin and then specify the parameters.
[tank]
; Disable phantom:
plugin_phantom=
; Enable Pandora instead:
plugin_pandora=yandextank.plugins.Pandora

; Pandora config section:
[pandora]

; Pandora executable path
pandora_cmd=/usr/bin/pandora

; Enable/disable expvar monitoring
expvar = 1 ; default

; Pandora config contents (json)
config_content = {
  "pools": [
  {
    "name": "dummy pool",
    "gun": {"type": "log"},
    "ammo": {
      "type": "dummy/log",
      "AmmoLimit": 10000000
    },
    "result": {
      "type": "log/phout",
      "destination": "./phout.log"
    },
    "shared-limits": false,
    "user-limiter": {
      "type": "unlimited"
    },
    "startup-limiter": {
      "type": "periodic",
      "batch": 1,
      "max": 5,
      "period": "0.5s"
    }
  }]}

; OR config file (yaml or json)
config_file = pandora_config.yml
Schedules
The first schedule type is periodic schedule. It is defined as periodic(<batch_size>, <period>, <limit>).
Pandora will issue one batch of size batch_size, once in period seconds, maximum of limit ticks. Those ticks may be
used in different places, for example as a limiter for user startups or as a limiter for each user request rate.
Example:
startup_schedule = periodic(2, 0.1, 100)
user_schedule = periodic(10, 15, 100)
shared_schedule = 0
Start 2 users every 0.1 seconds, 100 batches, maximum of 2 * 100 = 200 users. Each user will issue requests in batches of 10 requests, every 15 seconds, maximum of 100 requests. All users will read from one ammo source.
Second schedule type is linear. It is defined like this: linear(<start_rps>, <end_rps>, <time>).
Example:
user_schedule = linear(.1, 10, 10m)
shared_schedule = 1
The load will raise from .1 RPS (1 request in 10 seconds) until 10 RPS during 10 minutes. Since
shared_schedule is 1, this defines the overall load.
The last schedule type is unlimited. It has no parameters and users will shoot as soon
as possible. It is convenient to use this type of load to find out maximum performance of a
service and its level of parallelism. You should limit the loop number if you want the test
to stop eventually.
Example:
loop = 1000000
startup_schedule = periodic(2, 10, 50)
user_schedule = unlimited()
shared_schedule = 0
Start 2 users every 10 seconds. Every user will shoot without any limits (next request is sended as soon as the previous response have been received). This is analogous to phantom’s instances schedule mode.
Artifact uploaders
Note
Graphite uploader, InfluxDB uploader and BlazeMeter Sense are not currently supported in the last Yandex.Tank version. If you want one of them, use 1.7 branch.
Yandex.Overload
Overload 𝛃 is a service for performance analytics made by Yandex. We will store your performance experiments results and show them in graphic and tabular form. Your data will be available at https://overload.yandex.net.
INI file section: [overload]
Options
| token_file: | Place your token obtained from Overload (click your profile photo) into a file and specify the path here |
|---|---|
| job_name: | (Optional) Name of a job to be displayed in Yandex.Overload |
| job_dsc: | (Optional) Description of a job to be displayed in Yandex.Overload |
Example:
[tank]
; plugin is disabled by default, enable it:
plugin_uploader=yandextank.plugins.DataUploader overload

[overload]
token_file=token.txt
job_name=test
job_dsc=test description
Handy tools
Auto-stop
The Auto-stop module gets the data from the aggregator and passes them to the criteria-objects that decide if we should stop the test.
INI file section: [autostop]
Options
| autostop: | Criteria list divided by spaces, in following format: type(parameters) |
|---|
Basic criteria types
| time: | Stop the test if average response time is higher then allowed. Example: Exit code - 21 |
|---|---|
| http: | Stop the test if the count of responses in time period (specified) with HTTP codes fitting the mask is larger then the specified absolute or relative value. Examples: |
| net: | Like Exit code - 23 |
| quantile: | Stop the test if the specified percentile is larger then specified level for as long as the time period specified. Available percentile values: 25, 50, 75, 80, 90, 95, 98, 99, 100. Example: |
| instances: | Available when phantom module is included. Stop the test if instance count is larger then specified value. Example: Exit code - 24 |
| metric_lower and metric_higher: | |
Stop test if monitored metrics are lower/higher than specified for time period. Example: metric_lower(127.0.0.1,Memory_free,500,10). Exit code - 31 and 32 Note: metric names (except customs) are written with underline. For hostnames masks are allowed (i.e target-*.load.net) |
|
| steady_cumulative: | |
Stops the test if cumulative percentiles does not change for specified interval. Example: Exit code - 33 |
|
| limit: | Will stop test after specified period of time. Example: |
Basic criteria aren’t aggregated, they are tested for each second in specified period. For example autostop=time(50,15) means “stop if average responce time for every second in 15s interval is higher than 50ms”
Advanced criteria types
| total_time: | Like Example: Exit code - 25 |
|---|---|
| total_http: | Like Example: Exit code - 26 |
| total_net: | Like Example: Exit code - 27 |
| negative_http: | Inversed Example: Exit code - 28 |
| negative_net: | Inversed Example: Exit code - 29 |
| http_trend: | Stop if trend for defined http codes is negative on defined period. Trend is a sum of an average coefficient for linear functions calculated for each pair points in last n seconds and standart deviation for it Example: http_trend(2xx,10s). Exit code - 30 |
Telegraf
Runs metrics collection through SSH connection. You can debug your SSH connection using yandex-tank-check-ssh tool.
It is supplied with Yandex.Tank.
Thanks to https://github.com/influxdata/telegraf for metric collection agent.
For using this plugin, replace old plugin plugin_monitoring=yandextank.plugins.Monitoring in .ini file with this:
[tank]
plugin_monitoring=yandextank.plugins.Telegraf
In https://github.com/yandex/yandex-tank/blob/master/yandextank/core/config/00-base.ini it is already done. Please, don’t use both plugin_monitoring=yandextank.plugins.Telegraf and plugin_monitoring=yandextank.plugins.Monitoring simultaneously.
INI file section: [telegraf]
You can use old monitoring config format, if you specify it in [monitoring] section. Telegraf plugin transparently supports it. You can use new monitoring config format, if you specify it in [telegraf] section.
Backward compatibility logic:

Telegraf plugin automatically uploads telegraf collector binary to target from tank if exists.
Options
| config: | Path to monitoring config file. Default: |
|---|---|
| default_target: | An address where from collect “default” metrics. When phantom module is used, address will be obtained from it. |
| ssh_timeout: | Ssh connection timeout. Default: 5s |
Configuration
Net access and authentication
Telegraf requires ssh access to hosts for copy and executing agents/telegraf collector binaries on them. SSH session is established with user account specified by “username” parameter of Host element, otherwise current user account, so you need to copy your public keys (ssh-copy-id) and enable nonpassword authorization on hosts.
If connection establishing failed for some reason in ssh_timeout seconds, corresponding message will be written to console and monitoring log and task will proceed further.
Tip: write to .ssh/config next lines to eliminate -A option in ssh
StrictHostKeyChecking no
ForwardAgent yes
Configuration file format
Config is an XML file with structure:
root element Monitoring includes elements Host which contains elements-metrics
Example:
<Monitoring>
    <Host address="somehost.tld" interval="1" username="netort">
        <CPU fielddrop='["time_*", "usage_guest_nice"]'></CPU>
        <Kernel fielddrop='["active", "inactive", "total", "used_per*", "avail*"]'></Kernel>
        <Net fielddrop='["icmp*", "ip*", "udplite*", "tcp*", "udp*", "drop*", "err*"]' interfaces='["eth0","eth1","lo"]'></Net>
        <System fielddrop='["n_users", "n_cpus", "uptime*"]'></System>
        <Memory fielddrop='["active", "inactive", "total", "used_per*", "avail*"]'></Memory>
        <Disk devices='["vda1","sda1","sda2","sda3"]'></Disk>
        <Netstat />
        <Custom diff="1" measure="call" label="test">curl -s -H 'Host: host.tld' 'http://localhost:6100/stat'  | python -c 'import sys, json; j = json.load(sys.stdin); print "\n".join(`c["values"]["accept"]` for c in j["charts"] if c["name"] == "localqueue_wait_time")'</Custom>
        <Source>/path/to/file</Source>
        <TelegrafRaw>
            [[inputs.ping]]
            urls = ["127.0.0.1"]
            count = 1
        </TelegrafRaw>
    </Host>

    <Host address="localhost" telegraf="/usr/bin/telegraf">
        <CPU percpu="true"></CPU>
        <NetResponse address="localhost:80" protocol="tcp" timeout="1s"></NetResponse>
        <Net fielddrop='["icmp*", "ip*", "udplite*", "tcp*", "udp*", "drop*", "err*"]' interfaces='["eth0","eth1","docker0","lo"]'></Net>
    </Host>
</Monitoring>
Element Host
Contains address and role of monitored server. Attributes:
| address=”<IP address or domain name>: | |
|---|---|
Server adddress. Mandatory. Special mask |
|
| port=”<SSH port>”: | |
Server’s ssh port. Optional. Default: 22 |
|
| python=”<python path>”: | |
The way to use alternative python version. Optional. |
|
| interval=”<seconds>”: | |
Metrics collection interval. Optional. Default: 1 second |
|
| comment=”<short commentary>”: | |
Short notice about server’s role in test. Optional. Default: empty |
|
| username=”<user name>”: | |
User account to connect with. Optional. Default: current user account. |
|
| telegraf=”/path/to/telegraf”: | |
Path to telegraf binary on remote host. Optional. Default: /usr/bin/telegraf |
|
Example:
<Host address="localhost" comment="frontend" interval="5" username="tank"/>
Metric elements
Metric elements in general are set by metrics group name.
There are plenty of config-wide configuration options (such as ‘fielddrop’, ‘fieldpass’ etc, you can read about them here: https://github.com/influxdata/telegraf/blob/master/docs/CONFIGURATION.md
List of metrics group names and particular metrics in them:
- CPU
- percpu - default: false
- System
- Memory
- Disk
- devices - default: “,”.join([‘“vda%s”,”sda%s”’ % (num, num) for num in range(6)]). Format sample: [“sda1”, “docker0”]
- Net
- interfaces - default: “,”.join([‘“eth%s”’ % (num) for num in range(6)]). Format sample: [“eth0”,”eth1”]
- Netstat
- Kernel
- KernelVmstat
- NetResponse
- protocol - default: “tcp”. Protocol, must be “tcp” or “udp”
- address - default: “:80”. Server address and port
- timeout - default: “1s”. Set timeout
- send - default: None. Optional string sent to the server
- expect - default: None. Optional expected string in answer
- Custom
- diff - default: 0
- measure - default: call - metric value is a command or script execution output. Example: <Custom measure=”call” diff=”1” label=”Base size”>du -s /var/lib/mysql/ | awk ‘{print $1}’</Custom>
- TelegrafRaw
- raw telegraf TOML format, transparently added to final collector config
- Source additional source file in telegraf json format, can be used to add custom metrics that needs complex processing and do not fit into standart custom metrics (like log parsing with aggregation)
Console on-line screen
Shows usefull information in console while running the test
INI file section: [console]
Options
| short_only: | Show only one-line summary instead of full-screen. Usefull for scripting. Default: 0 (disabled) |
|---|---|
| info_panel_width: | |
relative right-panel width in percents, Default: 33 |
|
| disable_all_colors: | |
Switch off color scheme Available options: 0/1 Default: 0 |
|
| disable_colors: | Don’t use specified colors in console. List with whitespaces. Example: |
Aggregator
The aggregator module is responsible for aggregation of data received from different kind of modules and transmitting that aggregated data to consumer modules (Console screen module is an example of such kind).
INI file section: [aggregator]
Options
| verbose_histogram: | |
|---|---|
Controls the accuracy of cumulative percentile. Available options: 0/1. Default: |
|
ShellExec
The ShellExec module executes the shell-scripts (hooks) on different stages of test, for example, you could start/stop some services just before/after the test. Every hook must return 0 as an exit code or the test is terminated. Hook’s stdout will be written to DEBUG, stderr will be WARNINGs.
Example: [shellexec] start=/bin/ls -l.
Note
Command quoting is not needed. That line doesn’t work: start="/bin/ls -l"
INI file section: [shellexec]
Options
| prepare: | The script to run on prepare stage. |
|---|---|
| start: | The script to run on start stage. |
| poll: | The script to run every second while the test is running. |
| end: | The script to run on end stage. |
| post_process: | The script to run on postprocess stage |
Resource Check
Module checks free memory and disk space amount before and during test. Test stops if minimum values are reached.
INI file section: [rcheck]
Options
| interval: | How often to check resources. Default interval: |
|---|---|
| disk_limit: | Minimum free disk space in MB. Default: |
| mem_limit: | Minimum free memory amount in MB. Default: |
RC Assert
Module checks test’s exit code with predefined acceptable codes. If exit code matches, it is overrides as 0. Otherwise it is replaced with code from option fail_code
INI file section: [rcassert]
Options
| pass: | list of acceptable codes, delimiter - whitespace. Default: empty, no check is performed. |
|---|---|
| fail_code: | Exit code when check fails, integer number. Default: 10 |
Tips&Tricks
Shows tips and tricks in fullscreen console.
INI-file section: [tips]
Options
| disable: | Disable tips and tricks. Default: 0 (don’t). |
|---|
Deprecated
Monitoring
Runs metrics collection through ssh connect.
INI file section: [monitoring]
Options
| config: | Path to monitoring config file. Default: |
|---|---|
| default_target: | An address where from collect “default” metrics. When phantom module is used, address will be obtained from it. |
| ssh_timeout: | Ssh connection timeout. Default: 5s |
Artifacts
| agent_*.cfg: | Configuration files sent to hosts to run monitoring agents. |
|---|---|
| agent_<host>_*.log: | |
| Monitoring agents’ log files, downloaded from hosts. | |
| monitoring_*.data: | |
| Data collected by monitoring agents, received by ssh. | |
| <monitoring config: | |
| Monitoring config file. | |
Configuration
Net access and authentication
Monitoring requires ssh access to hosts for copy and executing agents on them. SSH session is established with user account specified by “username” parameter of Host element, otherwise current user account, so you need to copy your public keys (ssh-copy-id) and enable nonpassword authorization on hosts.
If connection establishing failed for some reason in ssh_timeout seconds, corresponding message will be written to console and monitoring log and task will proceed further.
Tip: write to .ssh/config next lines to eliminate -A option in ssh
StrictHostKeyChecking no
ForwardAgent yes
Configuration file format
Config is an XML file with structure:
root element Monitoring includes elements Host which contains elements-metrics
Example:
<Monitoring>
  <Host address="xxx.load.net">
    <CPU measure="user,system,iowait"/>
    <System measure="csw,int"/>
    <Memory measure="free,used"/>
    <Disk measure="read,write"/>
    <Net measure="recv,send"/>
  </Host>
</Monitoring>
Element Monitoring
Global monitoring settings.
| loglevel: | Logging level. Available options: Default: info. |
|---|
Element Host
Contains address and role of monitored server. Attributes:
| address=”<IP address or domain name>: | |
|---|---|
Server adddress. Mandatory. Special mask |
|
| port=”<SSH port>”: | |
Server’s ssh port. Optional. Default: 22 |
|
| python=”<python path>”: | |
The way to use alternative python version. Optional. |
|
| interval=”<seconds>”: | |
Metrics collection interval. Optional. Default: 1 second |
|
| comment=”<short commentary>”: | |
Short notice about server’s role in test. Optional. Default: empty |
|
| username=”<user name>”: | |
User account to connect with. Optional. Default: current user account. |
|
Example:
<Host address="localhost" comment="frontend" priority="1" interval="5" username="tank"/>
Metric elements
Metric elements in general are set by metrics group name and particular metrics enumeration in attribute measure. Example: <CPU measure=”idle,user,system” />
List of metrics group names and particular metrics in them:
- CPU
- idle
- user - default
- system - default
- iowait - default
- nice
- System
- la1 - load average 1 min
- la5 - …
- la15 - …
- csw - context switches, default
- int - interrupts, default
- numproc - process amount in system
- numthreads - threads amount in system
- Memory
- free - default
- used - default
- cached
- buff
- Disk
- read - default
- write - default
- Net
- recv - bytes received, default
- send - bytes sent, default
- tx - outgoing packet rate
- rx - incoming packet rate
- retransmit - retransmit amount
- estab - number of sockets in ESTABLISHED state
- closewait - number of sockets in CLOSEWAIT
- timewait - number of sockets in TIMEWAIT
- Custom
- tail - metric value is read from file’s last line, file path is specified in node text. Example: <Custom measure=”tail” label=”size history”>/tmp/dbsize.log</Custom>
- call - metric value is a command or script execution output. Example: <Custom measure=”call” diff=”1” label=”Base size”>du -hs /usr/mysql/data</Custom>
Custom metrics have an additional attribute diff, that signals to obtain as metric value the difference between previous and current value. So in example above, not the file size, but the dynamic of changes in size will be written. Also custom metrics must have attribute label, which defines metric short name (only latin). Underline symbol should be avoided.
Monitoring default logic
Default logic is applied on next levels:
- Host level: by default target is derived from address in phantom module.
- Metrics group level: If config contain host address only, without metrics, i.e <Host address=”somehost.yandex.ru” />, then default metrics in groups CPU, Memory, Disk are collected. If host has defined any metric, then only it is collected.
- Metric level: if metrics group is defined without attribute measure, then only default group metrics are collected.
Startup and Shutdown elements
There is special non-metric elements called Startup and Shutdown. Startup shell scripts will be started before metric collection. On the normal shutdown startup scripts will be stopped and shutdown scripts will run. There may be any number of Startup and Shutdown elements.
Following example illustrates this feature:
<Monitoring>
    <Host address="[target]">
        <Startup>cat /dev/urandom | hexdump | awk 'BEGIN {RS="0000"} {print length($0)}' > /tmp/urandom.txt</Startup>
        <Custom measure="tail" label="random int tail">/tmp/urandom.txt</Custom>
        <Custom measure="call" label="random int call">tail -n1 /tmp/urandom.txt</Custom>
        <Shutdown>rm /tmp/urandom.txt</Shutdown>
    </Host>
</Monitoring>